Lab K205 - Monitoring setup with HELM
In this lab, you are going to install and configure helm, and in turns, use it to configure a monitoring system for kubernetes using prometheus and grafana stack.
Installing Helm
oc login -u system:admin
oc new-project tiller
oc project tiller
export TILLER_NAMESPACE=tiller
To install helm you can follow following instructions.
curl https://raw.githubusercontent.com/kubernetes/helm/master/scripts/get > get_helm.sh
chmod 700 get_helm.sh
./get_helm.sh
Verify the installtion is successful,
helm --help
Initialise Helm
helm init --client-only
oc process -f https://github.com/openshift/origin/raw/master/examples/helm/tiller-template.yaml -p TILLER_NAMESPACE="${TILLER_NAMESPACE}" -p HELM_VERSION=v2.13.1 | oc create -f -


oc rollout status deployment tiller
Lets now setup RBAC configurations required for Tiller, a component of helm that runs inside the kubernetes cluster.
file: tiller-rbac.yaml
---
apiVersion: rbac.authorization.k8s.io/v1beta1
kind: ClusterRoleBinding
metadata:
  name: tiller
roleRef:
  apiGroup: rbac.authorization.k8s.io
  kind: ClusterRole
  name: cluster-admin
subjects:
  - kind: ServiceAccount
    name: tiller
    namespace: tiller
Apply the ClusterRole and ClusterRoleBinding.
oc apply -f tiller-rbac.yaml
Setting up Monitoring Stack with HELM
You will now setup prometheus and grafana monitoring stacks with helm, with a few customisations.
Install Prometheus with Helm
Before proceeding, you could review the Official Prometheus Helm Chart from the repository.
Search and download a chart for prometheus
cd ~
helm search prometheus
helm fetch --untar stable/prometheus
cd prometheus
To provide custom configurations, copy over the custom values file from oc-code repot.
cp ../oc-code/helper/helm/values/prometheus-customvalues.yaml .
Review prometheus-customvalues.yaml and then launch prometheus stack as,
oc project instavote

helm install --name prometheus --values prometheus-customvalues.yaml  . --dry-run
helm install --name prometheus --values prometheus-customvalues.yaml  .

cd ..

helm list
helm status prometheus

oc get pods
You should be able to access prometheus UI by using either the nodePort service or a ingress rule.
If containers in prometheus pod keeps crashing due not being able to write to a path, try running the following.
oc adm policy add-scc-to-group anyuid system:authenticated
and then delete the pod running prometheus-server so that it gets launched automatically.
oc get pods
kubectl delete pod prometheus-server-6c847f8d7f-5t5cl
oc get pods
warning: replace the pod id with what you on your system
Deploying Grafana with HELM
You could refer to the Official Grafana Helm Chart repository before proceeding.
Search and download a chart for prometheus
helm search grafana
helm fetch --untar stable/grafana
cd grafana
To provide custom configurations, copy over the custom values file from oc-code repot.
cp ../oc-code/helper/helm/values/grafana-customvalues.yaml .
Review grafana-customvalues.yaml and then launch grafana as,
helm install --name grafana --values grafana-customvalues.yaml  . --dry-run
helm install --name grafana --values grafana-customvalues.yaml  .

helm list
helm status grafana
You should be able to access grafana UI by using either the nodePort service or a route.
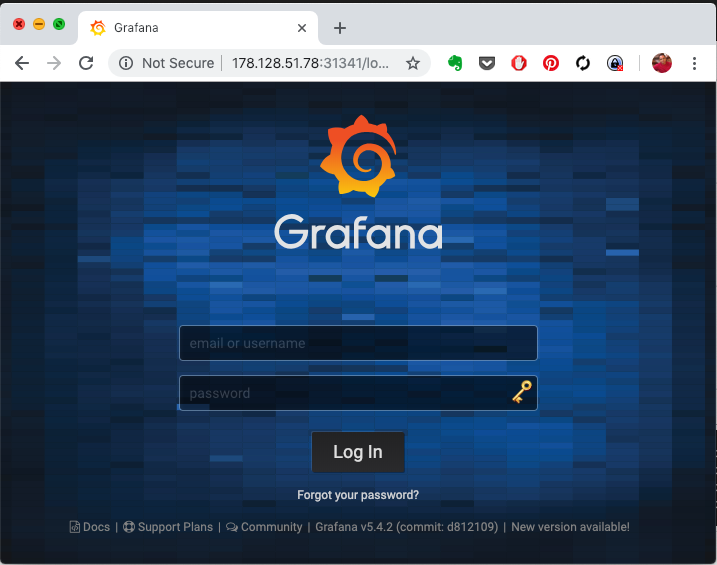
credentials for grafana
- user: admin
- pass: password
You could update it along with other values in grafana-customvalues.yaml or create a separate file to override the values.
If you update values and would like to apply to existing helm release, use a command simiar to following,
helm upgrade -f grafana-customvalues.yaml grafana .
Exercise
After you launch the prometheus stack, observe if node-exporter, which runs as a daemon set has any pods running? If not, why? Find out the root cause and fix it.
Summary
In this lab, we not only learnt about HELM, a kubernetes package manager, but also have setup a sophisticated health monitoring system with prometheus and grafana.